Sustainable Development · ongoing research · data 2019–9 Sep 2026
GridStress — Renewable Timing & Residual-Load Variability in Germany
More wind and solar. A sharper timing question.
Germany’s energy transition is not only a question of how much wind and solar electricity is produced, but whether supply and demand coincide. Wind and solar reduce residual load when they are available. Their weather-sensitive timing can also deepen midday valleys and alter the size of one-hour residual-load changes. GridStress examines this timing pattern using national hourly observations, calendar structure and transparent residual-load features.
01 · National daily rhythm
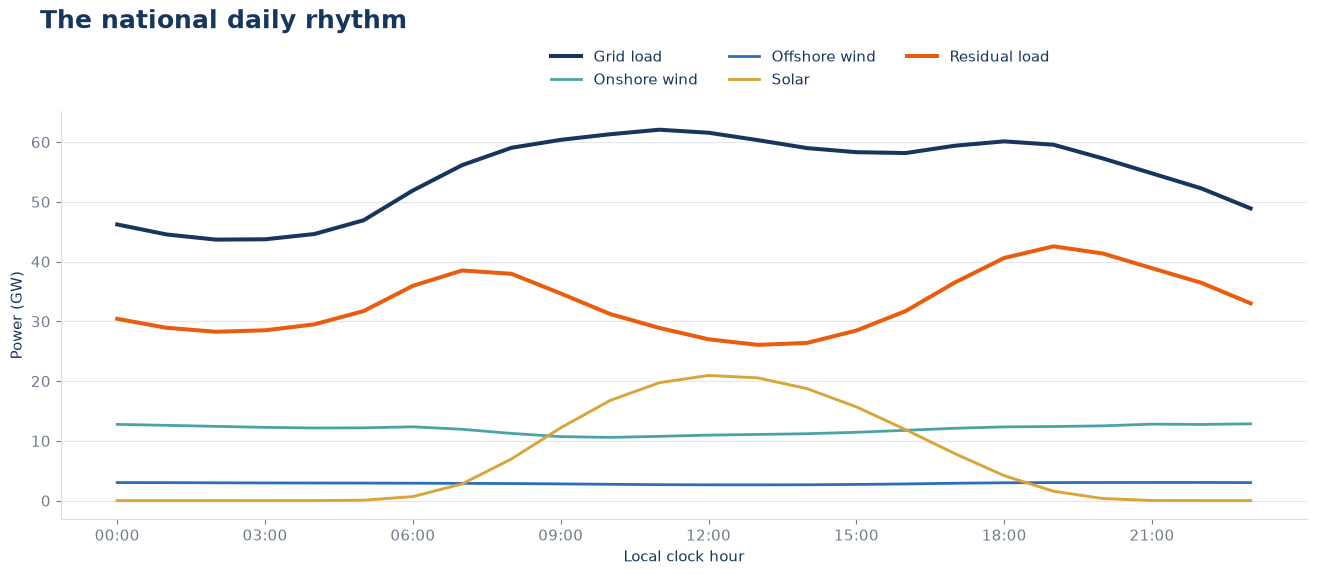
The national daily rhythm
Mean national profiles by local clock hour place grid load, onshore wind, offshore wind, solar and the derived residual load on the same axis. Solar peaks around midday, when residual load is lower relative to gross load. This is a descriptive multi-year national profile, not a dispatch or causal model.
02 · Matched annual level
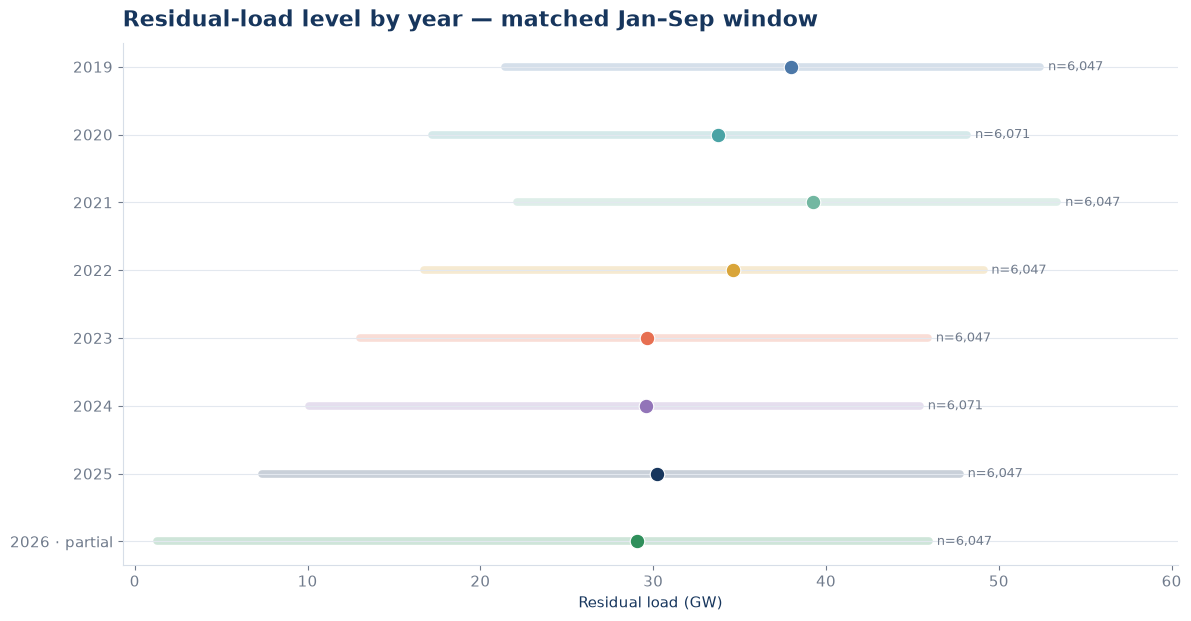
Residual-load level by year — matched Jan–Sep window
A matched January–September comparison places the annual residual-load level summaries on the same seasonal footing and reports the hourly sample count for each year. The panel is descriptive; 2026 is partial, and year-to-year differences are not attributed to a single driver.
03 · Calendar structure
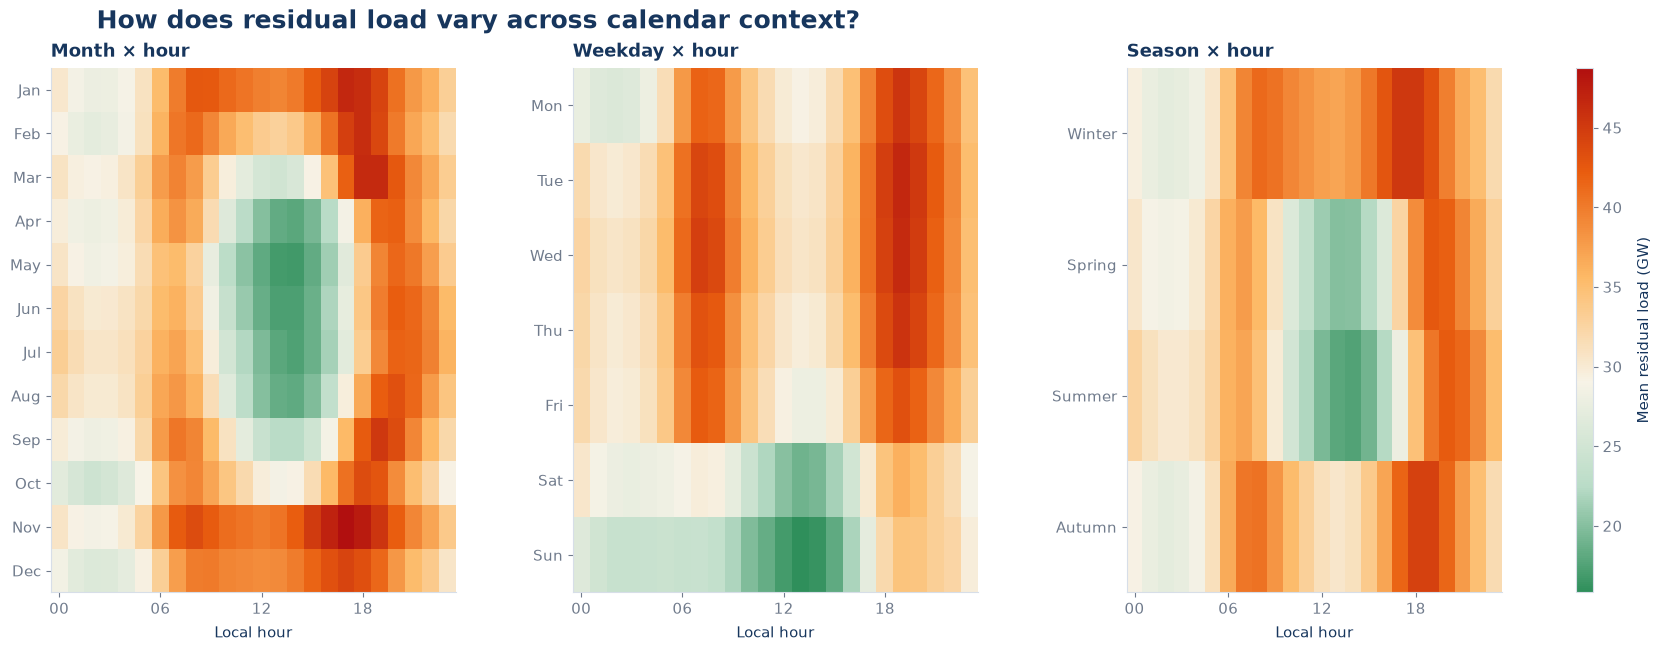
Residual demand has more than one clock
Mean residual load—grid load minus onshore wind, offshore wind and solar—varies strongly with local hour, month, weekday and season. These descriptive multi-year averages expose recurring calendar structure; they do not identify causal calendar effects.
04 · National holidays
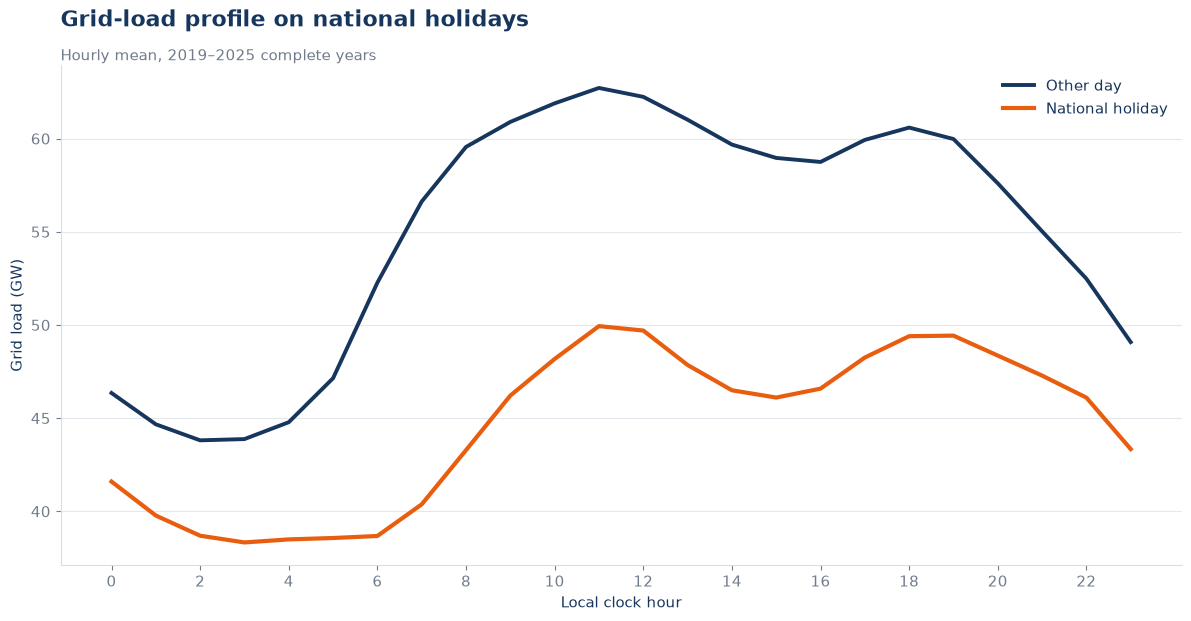
National holidays coincide with a lower, flatter load profile
Mean national grid load on Germany-wide public holidays lies below and is flatter than the other-day profile over the complete 2019–2025 years. The comparison is descriptive: weekday and seasonal composition are not matched, so it is not an estimated holiday effect.
05 · Football events
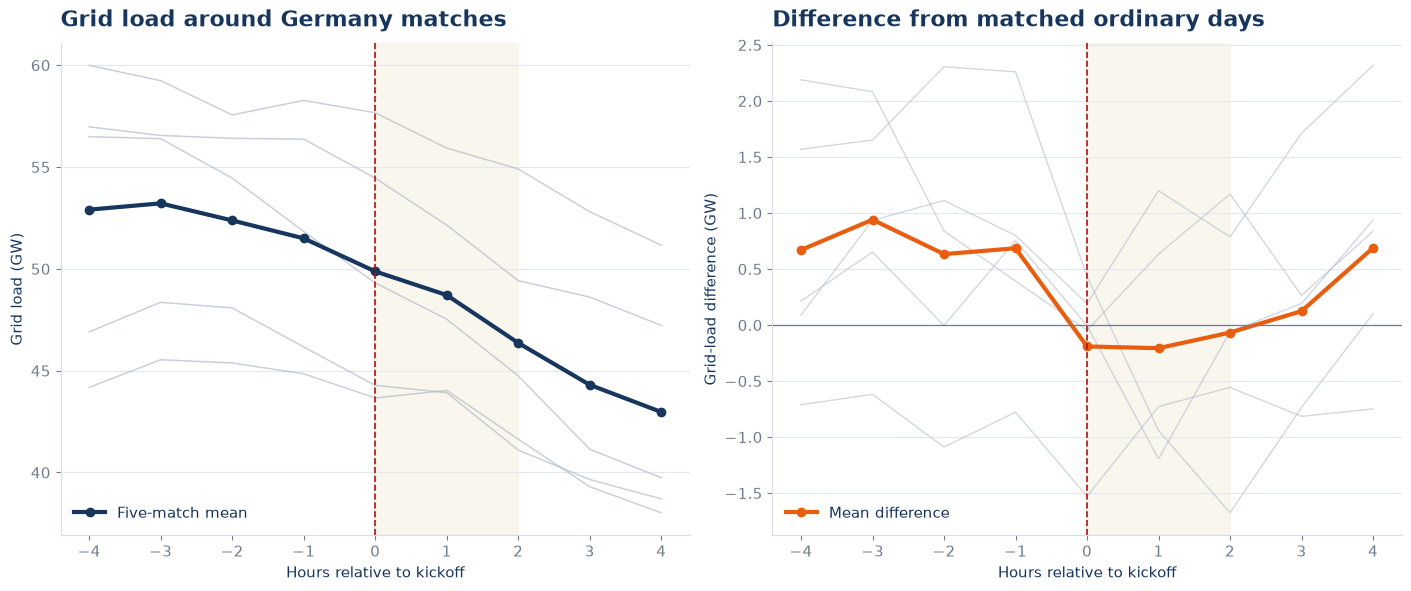
Not every synchronized event creates a uniform shock
Five Germany EURO 2024 match windows are compared with matched ordinary-day clock hours. Individual departures are mixed and the mean in-play difference is small. This is a descriptive event comparison, not an estimated football effect.
06 · Extreme ramps
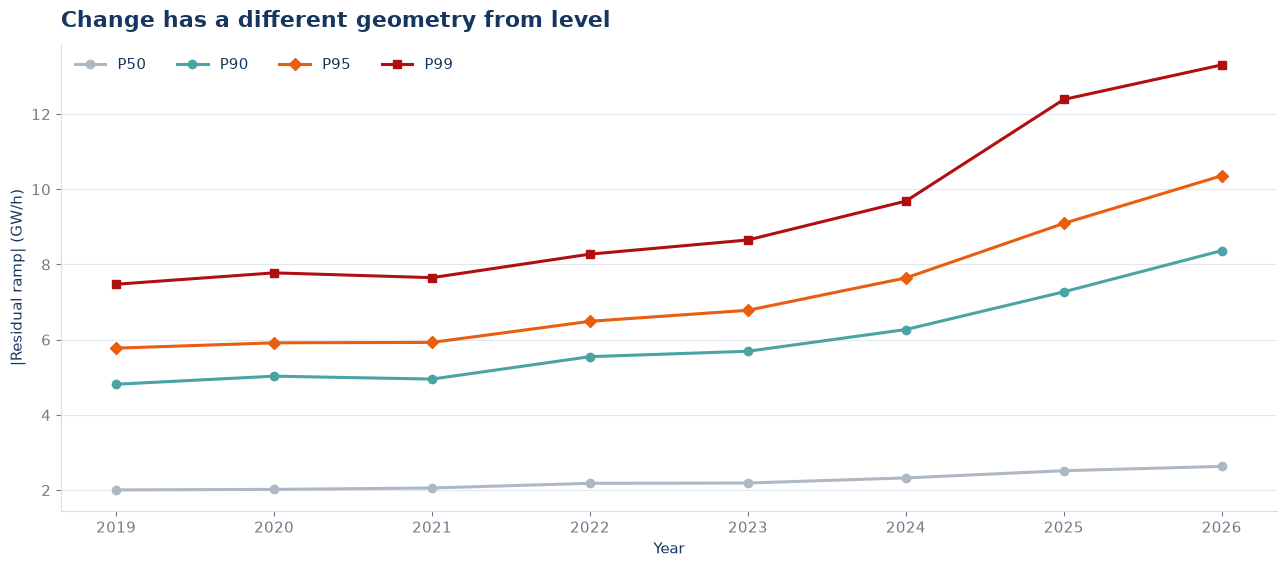
Change has a different geometry from level
Matched-window annual percentiles of absolute one-hour residual-load change show later-year upper-tail values rising more strongly than the median. This is a descriptive residual-load variability result and a flexibility-pressure proxy—not transmission congestion, reserve failure or frequency instability.
07 · Renewable contribution and change bins
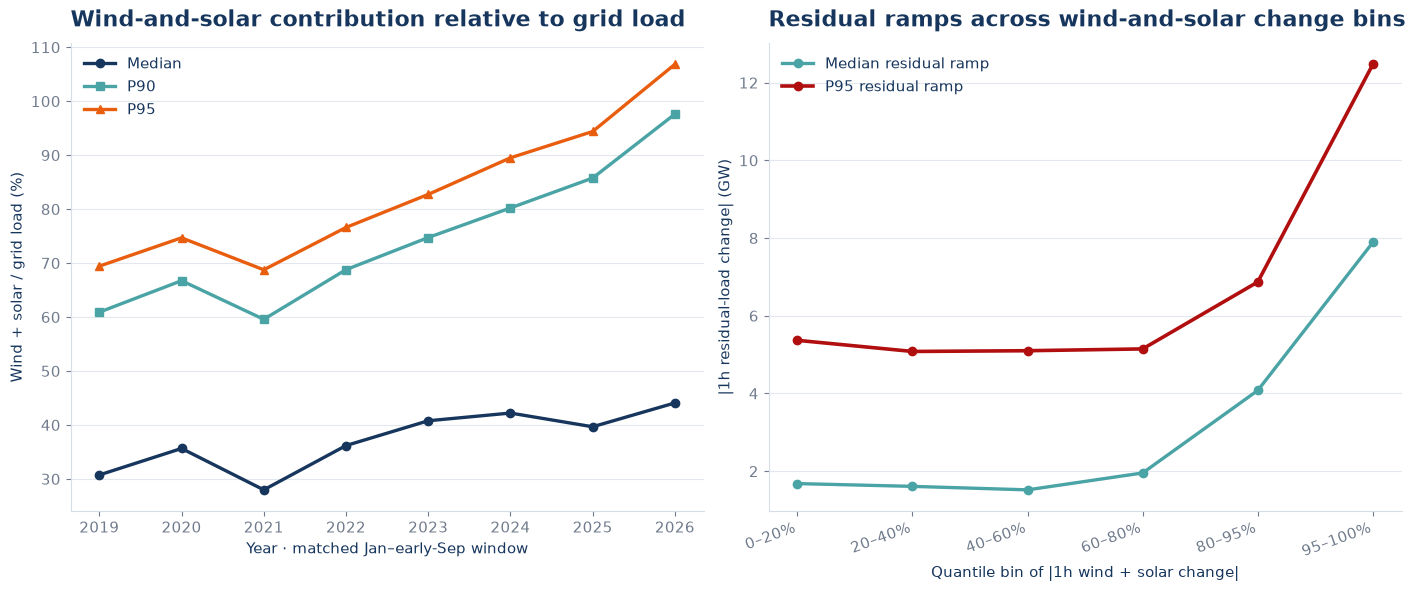
Wind-and-solar contribution and residual ramps can be read together
The left panel summarizes wind-and-solar contribution relative to grid load across matched annual windows. The right groups absolute one-hour wind-plus-solar changes and summarizes residual-load changes within those bins. Larger wind-and-solar-change bins coincide with larger residual-ramp summaries in this descriptive binning; this is not a causal effect and not forecast error.
Methods, sources and limits
- Analysis window: 1 January 2019 through 9 September 2026; 2026 is partial.
- National data: SMARD, Bundesnetzagentur—hourly grid load, onshore wind, offshore wind and solar.
- Derived measure: residual load = grid load − onshore wind − offshore wind − solar. It omits other generation, storage, imports, exports and losses, so it is not total dispatchable requirement.
- Units: aligned hourly-average values are shown in GW. A one-hour ramp is the difference between consecutive hourly-average GW observations.
- Event context: five Germany matches at UEFA EURO 2024; the comparison is descriptive and not a causal estimate.
- Reproducibility boundary: the exact cached raw-data snapshot is not bundled. The executed notebook, frozen figure outputs and SHA-256 manifest are retained in the project handover; reruns require SMARD access or the original cache.